Problem statement
The problem is, I have a tons of images to include in my weekly report. I used to think creating a pptx template with image placeholders is efficient enough, but reflecting back, it still wasted a lot of time going into each folder, dragging images, resizing them for each slide and so on. My brain was totally at rest while doing such operations, and essentially it means wasting many precious working hours per week.
After learning to program, I felt nothing is impossible and I had to get rid of this chore and further free up my time for learning. Thanks to my automation recipe for data collection, all my results are well structured and ready for some fun.
Project overview
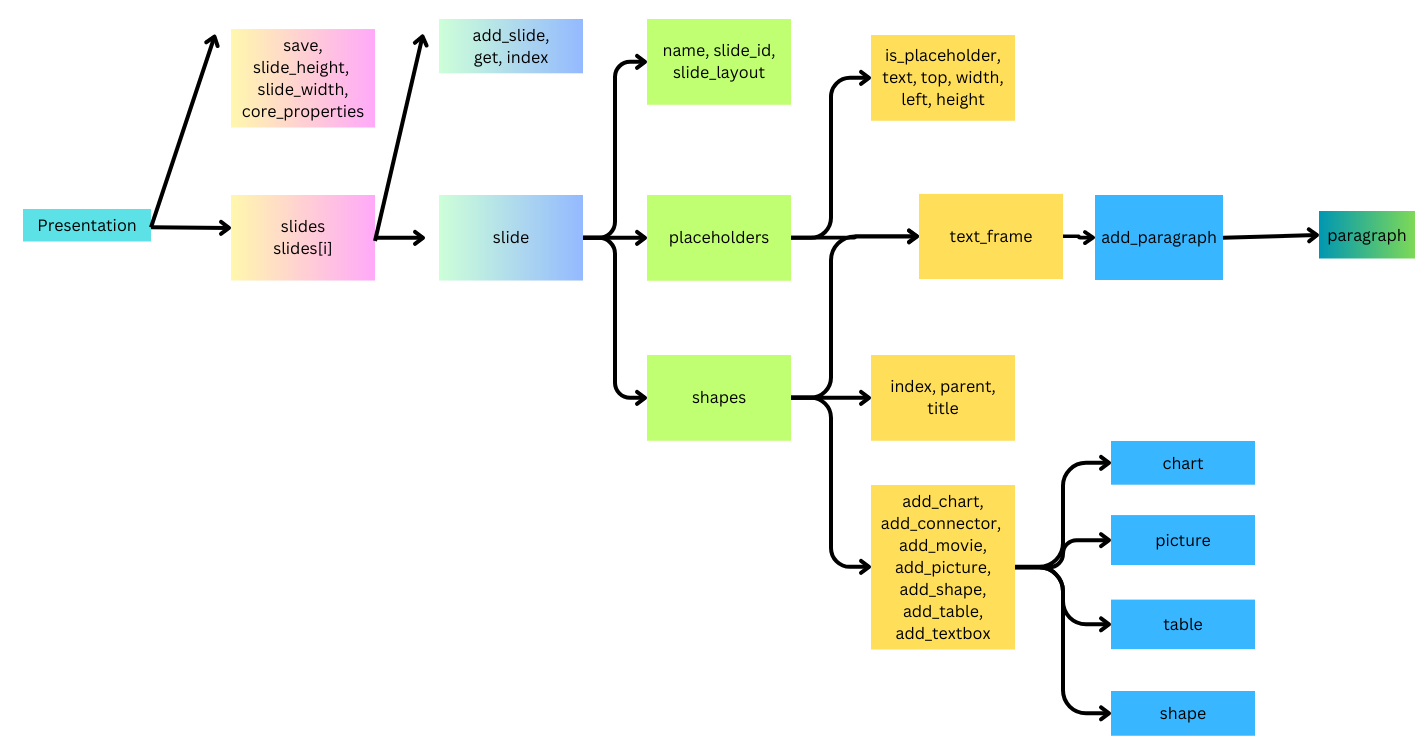
First, how to have my python script talk to powerpoint? Fortunately, these is already a module called pptx. The details for how to write the script for this part is explained very well by the documents. The user guild section is a great place to start. What I learned is that it is a object oriented module, and to access different section/function in the powerpoint, you need to know how to find the chain of object within each object. For exammple, if you'd like to access a title text_frame, then you need to start from the presentation object and then the slide object and then the shape object. An incomplete list of the relationship table is shown below:
Basically, I’d like my report have these parts:
- A cover page, with project title, author affiliation and report generation date.
- A summary page. It mainly consists a table listing all the sample information, such as sample name, identification number, test condition and test results. The table also has columns for FA findings for each sample, these columns will be filled by the learnings we got from computer vision or manually by an analyst after reviewing all images.
- A SEM overview page. It is used to display SEM images for all samples included in this report. In my case, each report has about 8 to 12 samples, and 2 SEM images for each sample is picked for this overview page.
- Pages for all TEM results. For each sample, ordered by the sequence in the summary table, there will be two types of pages:
- Type I: A single page for TEM image, with 8 images selected for each sample
- Type II: Pages for compositional results. Each page contains the complete information for a map, including HAADF image and all elemental maps. One sample could have multiple maps.
- End page with logo.
Preparation work
Make sure to have template saved at a target location thus the suitable colorscheme and page layout can be loaded from a template file.
Have a info.csv file that contians the following informaiton:
For Regular job type:
    FAR #           SN_pH    media   Slider_SN  runtime deadtime      status
    HDX-FAR-171  28A090A0_3  1870     AE0FF21E07    450     420          dead
    HDX-FAR-171  28A090A0_4  1870     AE1FF22C24    50      50           truncated
    HDX-FAR-172  28A090A1_6  1870     ABFFF31B33    778     778          truncated
For other job type:
    Seq SampleID     Extra1 Extra2  Extra3
    1   01_XC048_4B719  233     0       Dead
    2   02_XC048_07D0B  203     0       Dead
    3   03_XC048_4B426  234     200     Pass
    4   04_XC048_4B713  258     200     Pass
The info.csv file saves extra information other than sample name and such information is needed throughout the report for sample indentification. Meta data such as sample name, image mode and magnifications can be parsed from image file names.
- Make sure there is one TEM folder and one SEM folder under the root job folder. Inside TEM folder, there are sub_folders named with "01_AADEF_34ACD", and inside there are TEM images with the the same name as the subfolder name and suffix: "_TEM_10kx", "_TEM_21kx", "_TEM_43kx", "_TEM_88kx", "_TEM_88kx-1", "_TEM_88kx-2", "_STEM_205kx", "_STEM_490kx" , all images should be .tif images. The strict naming of the TEM files are enforced by data acquisition automation. Inside SEM folder, regardless of any subfolder structure, for each sample, there are at least two .tif images: "AADEF 34ACD_1KV NFT2.tif", "AADEF 34ACD_3KV NFT4.tif". It is okay for the SEM name to be named as "Hd11_AADEF 34ACD1KV NFT2.tif", as long as the first part is seperated by "".
The folder structure needed for the script to run is as below:
- Job_ID
- TEM
- Sample1
- Image1.tif
- Image2.tif
- Sample2
- Sample1
- SEM
- Group1
- Image1.tif
- Image2.tif
- Group2
- Image1.tif
- Image2.tif
- Group1
- Info.csv
- TEM
The main code
Most of the details are packaged into an object called Report saved in Report.py. The main code only need to import this object. There are several variables that needs to be fed into the object:
- The work directory where all the data are saved
- A title of description for the main purpose of the job
- In order to read the info.csv file correctly, we identify if it is a regular job or not.
- The template pptx file location.
from Report import Report
#Main code

#1. Prompt for the work directory
path = input("Job folder directory: ")

#2. Prompt for job title
job_title = input("What is the job about? ")


#3. Prompt for job type
job_type = input("'Regular' job or not?") or "Regular"

#4. Prompt for the powerpoint template location
template = input("Template file location:")

#Create a Report object job_report and generate_report
job_report = Report(path, job_type, template, job_title)
print("Object created")
job_report.generate_report()
print("Report generated")
job_report.print_note()
print("Please check additional notes")
The Report Object
There are several modules that needs to be imported. pptx for presention, including pptx.util for layout control, pptx.enum.text for text alignment and pptx.dml.color for text coloring. os is needed for file search and path editing,datetime is used for adding report time stamp, PIL is used to downsize original images to make it suitable for powerpoint slides.
It is actually essential to compress images since the original images are at least 1024X1024, so with hundreds of images added into a complete report, the final report size could be several hundred MB.
Last, pandas is used to keep track of all sample information as a dataframe, which is optional but I found it easy to use.
from pptx import Presentation
from pptx.util import Inches, Pt
from pptx.enum.text import PP_ALIGN
from pptx.dml.color import RGBColor
import os
from datetime import date
from PIL import Image
import pandas as pd
Object initialization
To create an object called report, there are many variables to initialize that would be used when generating each slide of the presentation. Also, we need to put all the default informaiton, as summary table columns and elements being tracked for compositional analysis into the object. Moreover, the information from info.csv file is being read into a dataframe called info_table for handy usage later. The Samples list is obtained from the TEM folder structure instead of info_table. It is because the actual samples being analyzed maybe less than the originally planned due to sample preparation yield and screening, and the sequence of analysis may be different from the info_table sequence.
class Report:
    def __init__(self, path, job_type,template, job_title):
        self.path = path
        self.job_description = job_title
        if job_type == 'Regular':
            self.Summary_cols = ["FAR", "SampleID", "Drive#", "Test Status", "Media", "Pt?",
                "coating integrity", "Device health", "Surface",
                "Pole Oxi/diff", "Smear elements", "Note"]
        else:
            self.Summary_cols = ["Seq","SampleID", "Extra1", "Extra2", "Extra3", "Pt?",
                "coating integrity", "Device health", "Surface",
                "Pole Oxi/diff", "Smear elements", "Note"]
        self.job_number = os.path.basename(path) # The last folder is the job number
        #These are the 20 elements being watched
        self.elem = ['HAADF', 'C', 'O', 'Si', 'N', 'Al', 'P', 'Mg', 'Cr', 'Fe', 'Co', 'Ru', 'Rh', 'Ta', 'Pt', 'Au', 'S', 'Ti', 'Sn', 'F']
        #Create a match between info.csv and sample list
        self.seq = []
        #Create a place to record smear_elements
        self.smear_elements = []
        #Constant
        self.Number_of_Variable = len(self.Summary_cols)
        #Get Sample information
        self.Samples = []
        self.getSample() #Samples is a list of [<Sample_name>, <Sample directory>]
        #Constant
        self.Number_of_Sample = len(self.Samples)
        #Read info.csv file into a dataframe call info_table
        self.info_table = self.get_info(job_type, path)
        #Create the presentation
        self.prs = Presentation(template)
        #Save the report file inside the path directory
        file_name = '%s pFA report.pptx' % (self.job_number)
        self.file_name = os.path.join(path,file_name)
        #Save an empty report in the job folder
        self.prs.save(self.file_name)
        self.notes = []
Belows are two function calls used in initialization to create a self.Samples list and a dataframe called self.info_table.
def get_info(self.job_type, path):
        df = pd.read_csv(os.path.join(path, 'info.csv'), dtype = str)
        #Tidy up info_table so that the information can be filled into the table accordingly
        if job_type == "Regular":
            df['FAR #'] = df['FAR #'].apply(lambda x: x[-3:] if pd.notnull(x) else x)
            new = []
            for i in range(len(df)):
                if df["status"][i] == "dead":
                    new.append("%s@%s/%s" % ("dead", df["deadtime"][i], df["runtime"][i]))
                elif df["status"][i] == "truncated":
                    new.append("%s@%s" % ("trunc", df["runtime"][i]))
                else:
                    new.append(df["status"][i])
            df['Test Status'] = new
            df.drop(['deadtime', 'runtime', 'status'], axis=1, inplace=True)
            df.rename(columns={'FAR #': 'FAR', "Slider_SN": 'SampleID', "SN_pH": "Drive#", "media": "Media"}, inplace=True)
        #Replace all nan values in info_table to '-'
        df = df.fillna('-')
        return df
For the regular job, the final info_table being imported looks like below:
        #    FAR       Drive#    Media     SampleID       Test Status
        #0   171   XYA0BGTB_0    1870       MM8DD-1EEWD  dead@484/502
        #1   176   XYA0BGTB_1    1870       MM8DD-137FM     trunc@784
        #2   172   XYA0BGTB_2    1870       MM8DD-21CYU     before LT
Acquire all sample names and sample subpath from the TEM folder:
def getSample(self):
        TEM_path = os.path.join(self.path, "TEM")
        for item in os.listdir(TEM_path):
            subpath = os.path.join(TEM_path, item)
            if os.path.isdir(subpath):
                self.Samples.append([item, subpath])
        return
Generate the pptx report
The majority of the work is done in the function call to generate report. The generate_report function itself is consisted of 7 functions, in which 6 functions are to create a specific kind of page and the last one is to automatically fill one column of the summary table.
def generate_report(self):
        # Add cover page
        self.addCover()
        print("Cover page added")
        # Add Summary
        self.addSummary()
        print("Summary page added")
        # Add SEM
        self.addSEM()
        print("SEM page added")
        # Add sample slides
        n = 0
        for sample_sn, s_path in self.Samples:
            self.addImage(n, sample_sn, s_path)
            print(f"{sample_sn} images added")
            self.addMap(n, s_path)
            print(f"{sample_sn} maps added")
            n += 1
        # Add the ending slide
        self.addEnd()
        print("End page added")
        # Auto fill the smear elements column
        self.addSmear()
        print("Smear added to list")
        return
Below are the function calls to create each page. Every function starts from creating a new slide in self.prs and ends by saving it.
1. Cover page
def addCover(self):
        slide = self.prs.slides.add_slide(self.prs.slide_layouts[4]) #No.4 is the title page
        f = slide.placeholders[0].text_frame
        f.margin_bottom = Inches(2) # Need to have "HAMR pFA" appear in the center of the page
        slide.placeholders[0].text = 'HAMR pFA'
        slide.placeholders[14].text = 'Job#: %s' % self.job_number
        slide.placeholders[11].text = 'Xiaolu \'Carol\'Kou, Fremont MSL'
        today = date.today()
        slide.placeholders[15].text = today.strftime("%b %d, %Y")
        self.prs.save(self.file_name)
        return
2. Summary page
def addSummary(self):
        slide = self.prs.slides.add_slide(self.prs.slide_layouts[0])
        title = slide.placeholders[11]
        title.text = self.job_description
        f = slide.placeholders[10]
        frame = f.insert_table(rows = self.Number_of_Sample + 1, cols = self.Number_of_Variable)
        table = frame.table
        #At most 12 columns in the table
        width = [0.36, 1.5, 1.18, 1.48, 0.68, 0.35, 1.65, 1.62, 0.66, 0.7, 1.42, 1.53]
        self.editTable(table, width, 5)
        self.prs.save(self.file_name)
        return
3. SEM page
def addSEM(self):
        SEM_path = os.path.join(self.path, "SEM")
        slide = self.prs.slides.add_slide(self.prs.slide_layouts[1]) #No.4 is the SEM page
        f = slide.placeholders[10]
        frame = f.insert_table(rows = self.Number_of_Sample + 1, cols = 4)
        table_s = frame.table
        width = [0.45, 1.5, 1.15, 1.48]
        #Add SEM page table
        self.editTable(table_s, width, 4)
        #Adjust table row heights
        table_s.rows[0].height = Inches(0.28)
        h = round((7 - 0.28)/self.Number_of_Sample, 2)
        for r in range(1, self.Number_of_Sample + 1):
                table_s.rows[r].height = Inches(h)
        #Calculate SEM image height and the corresponding width
        SEM_h, left, top = min(2 * h, 1.53), 4.6, 0.69
        #Have a dictionary to save all SEM image positions
        SEM_dict = {}
        for root, dirs, files in os.walk(SEM_path, topdown = False):
            for name in files:
                if name.endswith(".tif"):
                    temp = name.split("_")
                    if len(temp) == 3:
                        temp.pop(0)
                    sample_SN = temp[0].replace(" ", '_')#e.g. "AD8DD 1EE25" to "AD8DD_1EE25"
                    suffix = temp[1] #e.g. 1KV NFT2
                    SEM_dict[(sample_SN, suffix)] = os.path.join(root, name)
        suffix = ['1KV NFT2.tif', '3KV NFT4.tif']
        for i in range(self.Number_of_Sample):
            sample_SN = self.Samples[i][0][3:] #e.g. "AD8DD_1EE25"
            img_path1 = SEM_dict[(sample_SN, suffix[0])]
            img_path2 = SEM_dict[(sample_SN, suffix[1])]
            #Add Compressed image
            try:
                picture = Image.open(img_path1).convert('RGB')
                picture.save("Compressed.tif", "JPEG", quality = 50)
                slide.shapes.add_picture("Compressed.tif", Inches(left), Inches(top), height=Inches(SEM_h))
            except FileNotFoundError:
                print(f"{sample_SN}_1KV NFT2 not found")
                self.notes.append("%s_1KV NFT2 not found" % (sample_SN))
            left += 1.4 * SEM_h
            try:
                picture = Image.open(img_path2).convert('RGB')
                picture.save("Compressed.tif", "JPEG", quality = 50)
                slide.shapes.add_picture("Compressed.tif", Inches(left), Inches(top), height=Inches(SEM_h))
            except FileNotFoundError:
                print(f"{sample_SN}_3KV NFT4 not found")
                self.notes.append("%s_3KV NFT4 not found" % (sample_SN))
            left += 1.4 * SEM_h
            if i % 2 == 1:
                top += 2 * h
                left = 4.6
        os.remove("Compressed.tif")
        self.prs.save(self.file_name)
        return
4. TEM image page
def addImage(self, n, sample_sn, s_path):
        slide = self.prs.slides.add_slide(self.prs.slide_layouts[2])
        slide.placeholders[0].text = 'HAMR FA (%s)' % (self.job_number) #Edit title
        #Edit the label for sample
        f = slide.placeholders[28]
        frame = f.insert_table(rows = 1, cols = 5)
        t_table = frame.table
        self.editLabel(t_table, n)
        #Add images
        top = [1.34] * 4 + [4.44] * 4
        left = [0.33, 3.55, 6.77, 10] * 2
        suffix = ["_TEM_10kx", "_TEM_21kx", "_TEM_43kx", "_TEM_88kx", "_TEM_88kx-1", "_TEM_88kx-2", "_STEM_205kx", "_STEM_490kx"]
        for i in range(8):
            picture_name = '%s%s.tif' % (sample_sn, suffix[i])
            picture_path = os.path.join(s_path, picture_name)
            try:
                picture = Image.open(picture_path).convert('RGB')#Only after convert to RGB can the compression work in the next line.
                picture.save("Compressed.tif", "JPEG", quality = 50)
                slide.shapes.add_picture("Compressed.tif", Inches(left[i]), Inches(top[i]), height = Inches(3))
            except FileNotFoundError:
                print(f"{picture_name} image not found")
                self.notes.append("%s image not found" % (picture_name))
        os.remove("Compressed.tif")
        self.prs.save(self.file_name)
        return
5. TEM elemental maps page
def addMap(self, n, s_path):
        smear = set()
        #Iterate through all map folders in the s_path
        for item in os.listdir(s_path):
            if 'map' in item:
                subpath = os.path.join(s_path, item)
                slide = self.prs.slides.add_slide(self.prs.slide_layouts[3])#Each map folder add one slide
                slide.placeholders[0].text = 'HAMR FA (%s)' % (self.job_number) #Edit title
                #Edit the label for sample
                f = slide.placeholders[28]
                frame = f.insert_table(rows = 1, cols = 5)
                t_table = frame.table
                self.editLabel(t_table, n)
                #Add elemental maps
                self.addElements(subpath, slide, smear)
        self.prs.save(self.file_name)
        self.smear_elements.append(list(smear))
        return
6. End page
def addEnd(self):
        self.prs.slides.add_slide(self.prs.slide_layouts[12]) #No.12 is the ending page
        self.prs.save(self.file_name)
        return
There are some supporting functions being used for some slides like editing tables, labels or calcuting coordinates for images.
Edit table on the summary page and SEM page
def editTable(self, table, width, col_n):
        # Setup table text cell margins
        for row in table.rows:
            for cell in row.cells:
                cell.margin_left = Inches(0.05)
                cell.margin_right = Inches(0.05)
        #Setup table column width
        for i in range(len(width)):
            table.columns[i].width = Inches(width[i])
        #Add all Column names in the 1st row
        for i in range(self.Number_of_Variable):
            block = table.cell(0, i)
            block.text = self.Summary_cols[i]
            p = block.text_frame.paragraphs[0]
            p.font.size = Pt(11)
            p.alignment = PP_ALIGN.CENTER
            if i == 3 and col_n == 4:#For the smaller table on SEM, only 4 columns
                break
        #Fill in the table info row by row
        for i in range(self.Number_of_Sample):
            sample_SN = self.Samples[i][0]
            for j in range(self.Number_of_Sample):
                if self.info_table['SampleID'][j][-5:] == sample_SN[-5:]:#Use last 5 letters to match sample ID
                    self.info_table['SampleID'][j] = sample_SN
                    break#For Sample i in Samples, the corresponding info saved in info_table(j)
            self.seq.append(j)
            for k in range(col_n): # iterate through all columns for each table row i + 1
                cell = table.cell(i + 1, k)
                cell.text = self.info_table[self.Summary_cols[k]][j]
                p = cell.text_frame.paragraphs[0]
                p.font.size = Pt(11)
                p.alignment = PP_ALIGN.CENTER
                if k == 1: p.font.bold = True #Bold the serial number
                if k == 3:#color code the test status column
                    if cell.text[:4] == 'dead':
                        p.font.color.rgb = RGBColor(0xFF, 0x00, 0x00)
                    elif cell.text[:4] == 'trun':
                        p.font.color.rgb = RGBColor(0x19, 0x8A, 0x28)
                    else: p.font.color.rgb = RGBColor(0x7B, 0x1F, 0xB0)
        return
Add the label table for each image and map page
def editLabel(self, table, n):
        #Setup label table size
        table.rows[0].height = Inches(0.28)
        width = [0.47, 1.42, 1.24, 1.68, 1.58 ]
        j = self.seq[n]
        for i in range(len(width)):
            table.columns[i].width = Inches(width[i])
            cell = table.cell(0, i)
            cell.text = self.info_table[self.Summary_cols[i]][j]
            p = cell.text_frame.paragraphs[0]
            p.font.size = Pt(10)
            p.alignment = PP_ALIGN.CENTER
        return
Calculate coordinates for elemental maps
def map_location(self, image_path):
        img = Image.open(image_path)
        w, h = img.size
        ratio = min(2.65/h, 1.46/w)
        height = round(h * ratio, 2)
        width = round(w * ratio, 2)
        top = [1.65] * 9 + [4.68] * 7 + [4.71, 4.71, 6.16, 6.16]
        width = [width] * 16 + [round(width/2, 2)] * 4
        centers = [0.78, 2.25,3.71, 5.18, 6.65, 8.12, 9.58, 11.05, 12.52, 0.78, 2.25,3.71, 5.18, 6.65, 8.12, 9.58, 11.56, 12.80, 11.56, 12.80]
        left = [round(centers[i] - width[i]/2, 2) for i in range(20)]
        heights = [round(height * 0.97, 2)] * 16 + [round(height / 2 , 2)] * 4
        loc = [(left[i], top[i], heights[i]) for i in range(20)]
        return loc
Finally, Add the smear elements into the summary page. This has to be done at the end because the self.smear_elements list is being completed while generating the report.
def addSmear(self):
        slides = self.prs.slides
        summary = slides[1]
        table_holder = summary.placeholders[10]
        table = table_holder.table
        for i in range(len(self.smear_elements)):
            cell = table.cell(i + 1, 10)
            temp = self.smear_elements[i]
            if temp == []:
                cell.text = '-'
            else:
                cell.text = ", ".join(temp)
            p = cell.text_frame.paragraphs[0]
            p.font.size = Pt(10)
            p.alignment = PP_ALIGN.CENTER
        self.prs.save(self.file_name)
        return
Print note
As unexpected situations could happen for practical cases, such as files could not be found or elemental maps that wasn't part of the default list, all these messages are being recorded while generating the report. The last step is to have these message saved in notes.txt so that manual corrections can be made afterwards.
def print_note(self):
        file_path = os.path.join(self.path, 'notes.txt')
        with open(file_path, 'w') as file:
            for note in self.notes:
                file.write(note + '\n')
        return
Future work
At the completion of the current recipe, there are still some work left for manual completion. The majority of that work is reading the images and fill the summary table. Fortunately, all these work can be done through computer vision, so a seperate work will be done to train these deep learning models and further improve the automation in this work.